Take charts screenshots using Laravel Browsershot
3aslema.
Recently in one of my projects, I needed to generate charts to include them in a PDF report. Since most of charts are using JavaScript to render, and I am using DomPDF, so there is no way we can do that.
Searching online, I have found couple of websites that offer that service. But being the developer I am, I asked the ultimate question, "How can I build it myself ?".
So let's dive in.

.webp)
First things first, we need to use Laravel Browsershot, which requires Puppeteer. Puppeteer on Windows is painful, so we will use WSL here. But the guys using Mac or Ubuntu shouldn't have an issue.
Also, one more thing, you may ask, why you wouldn't use Browsershot directly and output beautiful documents.
You are right, but this tutorial is for educational purposes.
First thing, let's start our Ubuntu machine. Once everything has booted up , we will install Puppeteer (which requires Node JS to be installed).
Using the guide from Spatie Requirements Guide, run the following command.
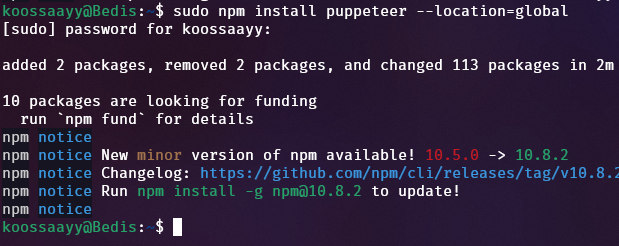
sudo npm install puppeteer --location=global
I would like to install it globally, because I might need it for future products. But you can install it for your specific project.
After installing Puppeteer, let's verify it running the following command:
puppeteer and you should the following output :
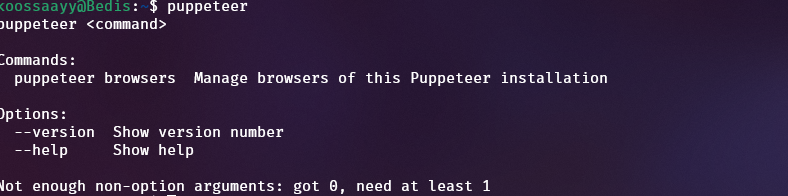
So everything is working okay now. Let's move on to our Laravel project.
Now let's install Laravel Browsershot. Open the terminal where your project is and run :
composer require spatie/browsershot
And we're good to go, now we will go to the code.
The first thing to do is to prepare the view that holds the chart. Create a view called chart.blade.php or anything else you want.
Start with a simple chart, as follows:
<!DOCTYPE html>
<html lang="en">

<head>
    <meta charset="UTF-8">
    <meta name="viewport" content="width=device-width, initial-scale=1.0">
    <meta http-equiv="X-UA-Compatible" content="ie=edge">
    <script src="https://cdn.jsdelivr.net/npm/chart.js"></script>
    <title>Chart</title>
</head>

<body>
    <canvas id="bar-chart" width="800" height="450"></canvas>

    <script>
        new Chart(document.getElementById("bar-chart"), {
            type: 'bar',
            data: {
                labels: ["Africa", "Asia", "Europe", "Latin America", "North America"],
                datasets: [{
                    label: "Population (millions)",
                    backgroundColor: ["#3e95cd", "#8e5ea2", "#3cba9f", "#e8c3b9", "#c45850"],
                    data: [2478, 5267, 734, 784, 433]
                }]
            },
            options: {
                legend: {
                    display: false
                },
                title: {
                    display: true,
                    text: 'Predicted world population (millions) in 2050'
                }
            }
        });
    </script>
</body>

</html>
This code seems simple enough, but you can change it later to whatever you want.
After defining the chart, and make sure there is no annoying JavaScript errors, we can move to the good part.
Define another route to use to invoke Browsershot. Next thing, we need to get the rendered HTML of the chart view. In order to do so, you can use
$view = view('chart')->render();
This will return the rendered HTML of the view, that we can pass to Browsershot, to take the screenshot
After that, we will call Browsershot to do its thing:
    Browsershot::html($view)
        ->deviceScaleFactor(3)
        ->newHeadless()
        ->noSandbox()
        ->setScreenshotType('png')
        ->save('chart.png');

    $img = file_get_contents(public_path('hello5.png'));
    return response($img)->header('Content-type', 'image/png');
Using this code will output the best quality of the screenshot, but as a tradeoff it will take a little more time, so take that into consideration.
After running the code, the chart will be outputted as follows:
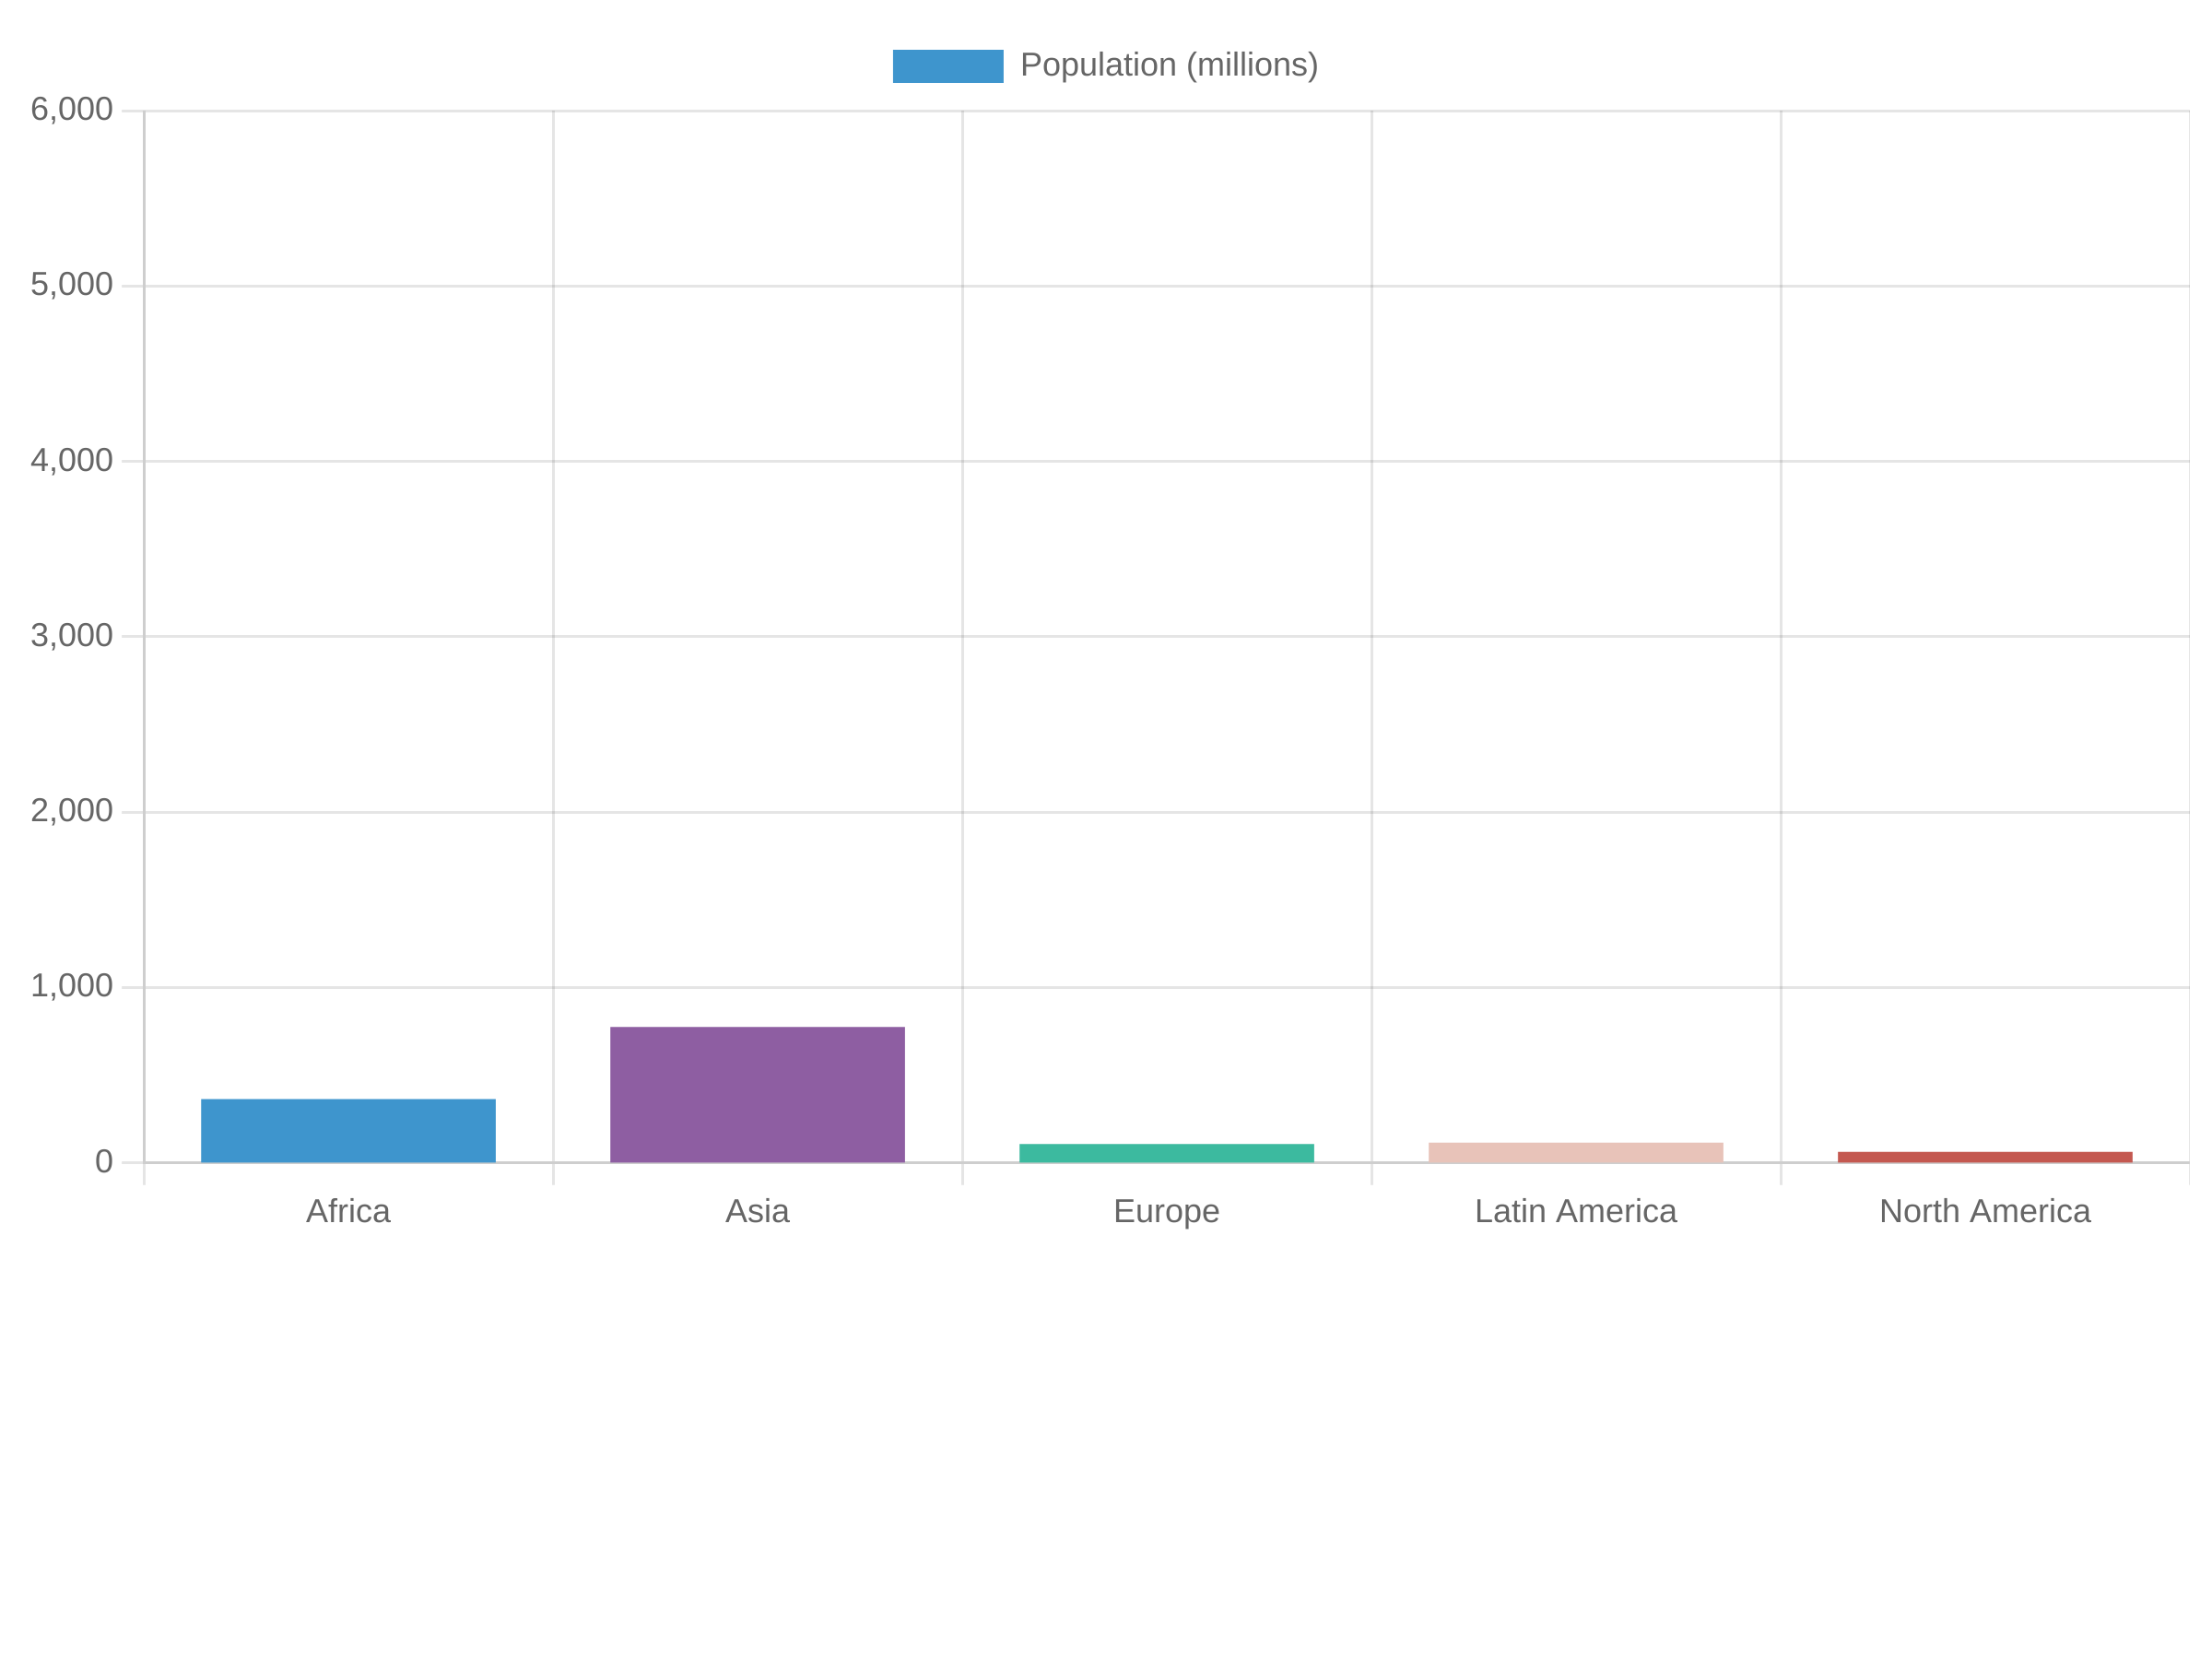
But as you can see, there is an extra space below and above the chart, because Browsershot took a screenshot of the whole page.
Luckily we can target the chart element itself using select('domElement') selector, so we can select only the chart.
So the code will be as follows:
    Browsershot::html($view)
        ->select('#bar-chart')
        ->deviceScaleFactor(3)
        ->newHeadless()
        ->noSandbox()
        ->setScreenshotType('png')
        ->save('chart.png');
After running the code, you can see the image is more clear now, and no extra space.
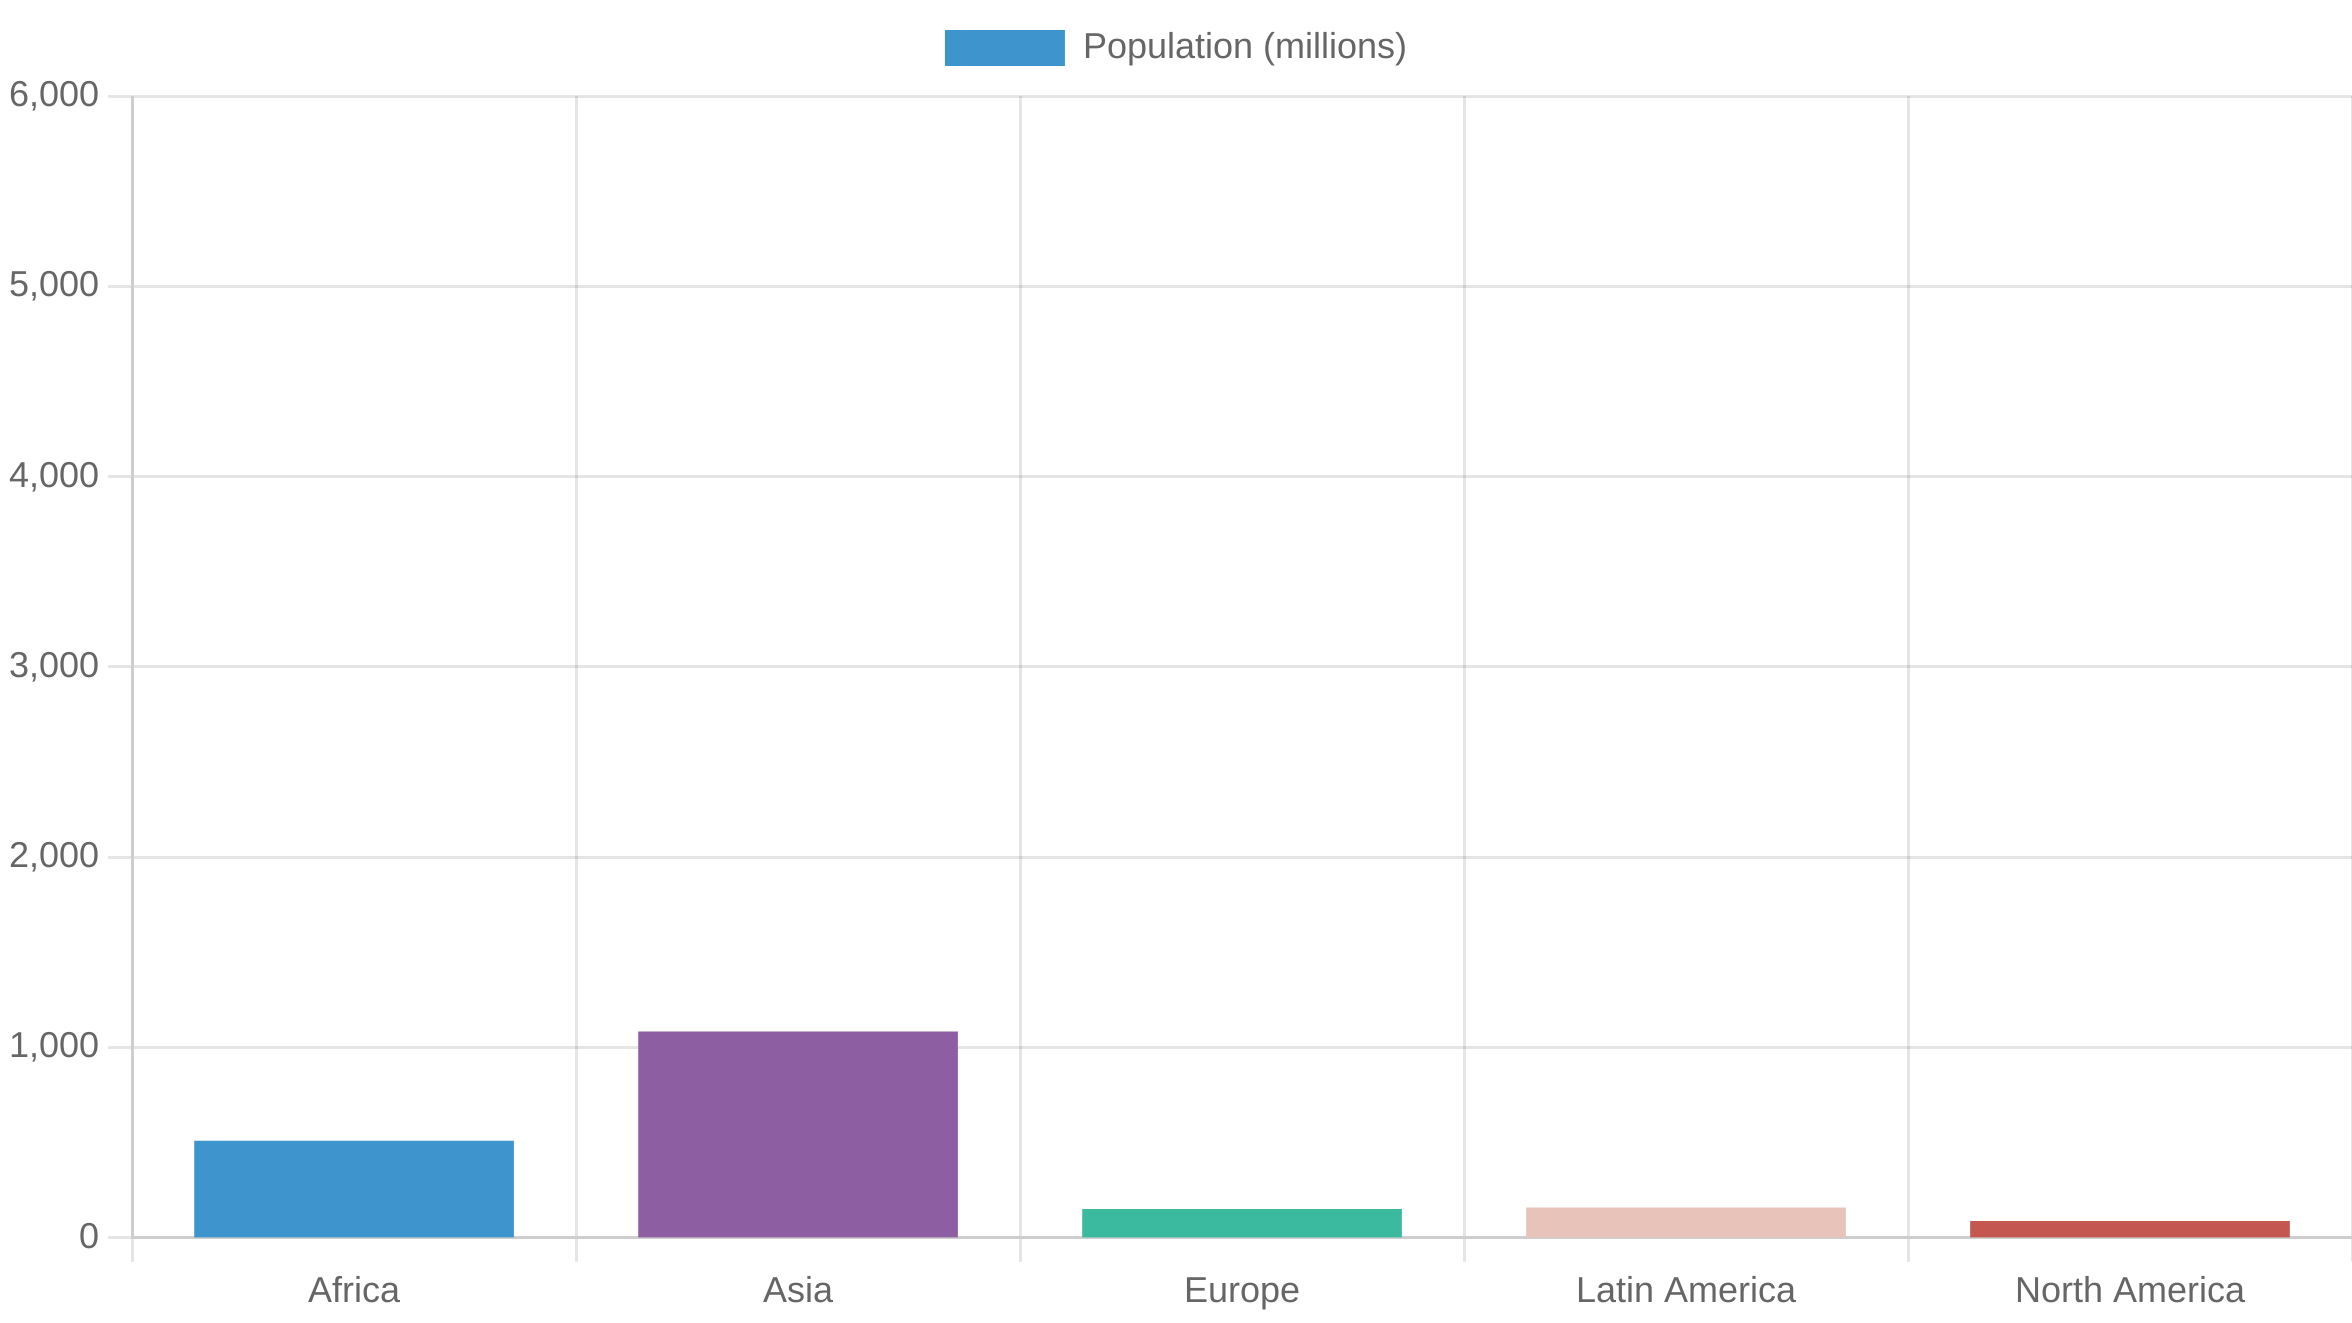
But from here the possibilities are endless, you can use multiple charts, or another chart library. You can also pass dynamic values to the chart. The sky is the limit.
That's it for this little tutorial, I hope everything is clear and easy to follow. If you have any question, or something to improve, well don't be a stranger.
Thank you, and see in the next one.